Slice Statistics - 4.4
Purpose
Slice Statistics offer some high-level insight into the inner workings of Slice. It's a simple tool that allows administrators to assess how many Slice Models are created on an AEM instance and how long they take to process. It can be used to discover performance problems in specific models in a non-intrusive way.
Features
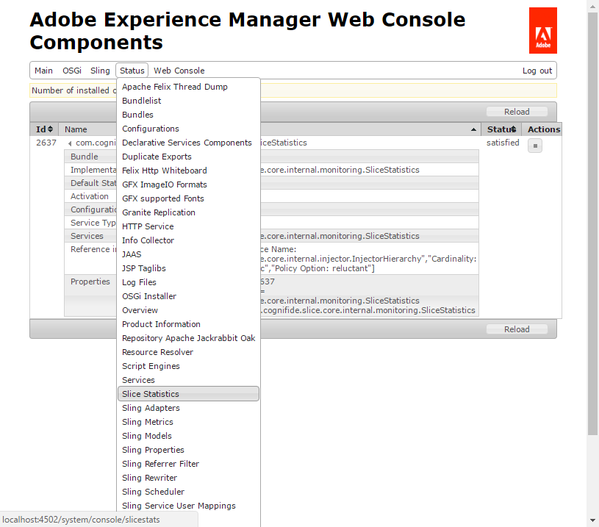
Statistics regarding Slice Models have been added to the OSGi console. In order to gather and view them, open the Apache Felix console and select Status > Slice Statistics, see the screenshot below.
Initially, no statistics will be available. To start gathering stats, click the Start button.
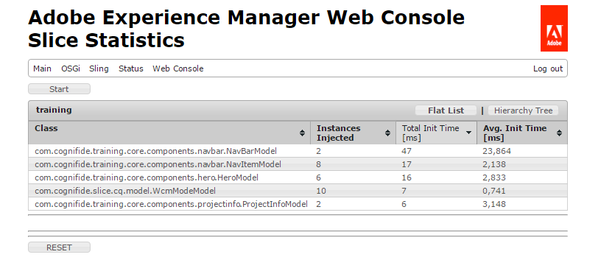
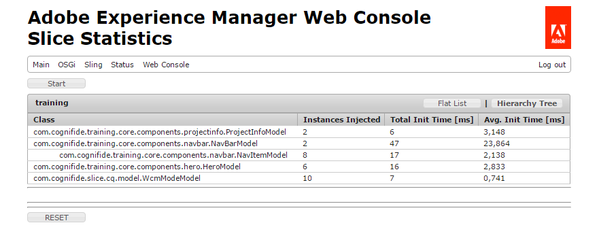
As AEM renders pages that use Slice Models, statistics will be gathered. Once you click the Stop button, they will be displayed in a tabular form or as a tree listing nested Slice Models in a readable manner.
The information available is:
- the number of instances of every model,
- the total time (in milliseconds) spent processing objects of each Model class, and
- the average time each type of Model takes to initialize.
The statistics are stored in memory. To clear previously gathered statistics, click the RESET button.
There is currently no way to export the statistics


